500,000 Reasons to Pay Attention to the Market & Your 401K Plan
An invaluable lesson learned the hard way
In 2000 & 2001 I saw my modest 401k cut by two thirds, as the NASDAQ went from 5,000 to 1,800. I thought I was doing everything right. I had been contributing with every paycheck. Had aggressive allocations since I was still a relative youngster. Thought everything was fine (there was still a touch of that go-go 90s vibe in the air, after all). But after I had settled into my new job and went through the process of setting up a new 401K and rolling over the old one into a Roth IRA, I had a WTF kind of moment. Two thirds - gone. That's nuts. I didn't know what to do, but I knew there had to be a better way.
I wish I could remember exactly how I found Dick Fabian's Mutual Fund Wealth Builder, because if anyone tipped me off I want to give them proper credit. But I may have just found it in Borders. And it changed my life. I know that might sound pretty weird and cultish, but it's true. His message isn't complicated. It gets pretty repetitive in places it definitely has stretches of high corniness. But the bottom line is he outlines a straightforward approach that is easy to follow and it can save your @ss in years like 2008.
The point is there are macro market trends that can give you a 'red light' or 'green light' kind of signal. Either get to safety and wait out the down draft, or get back on the elevator up.
I'm oversimplifying here, but if you see a couple of major, broad market indicators close below their 200-day moving average, that's a bad sign. On December 27, 2007, the S&P 500 dropped below its 200 day moving average.
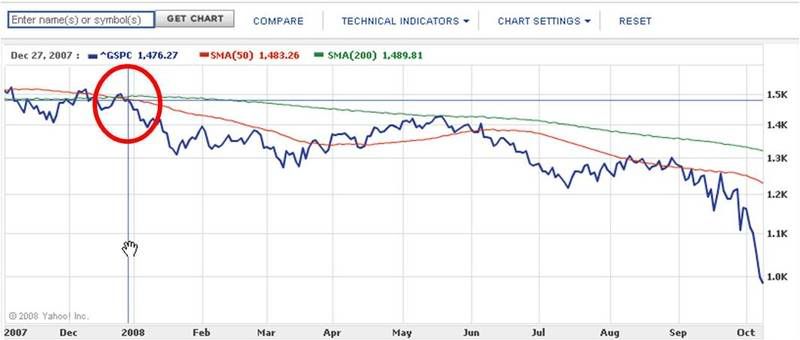
Image Source: Yahoo! Finance
S&P 500 closes below its 200 day moving average on 12/27/07
That was a real crap time for it to break down because I personally wasn't paying as close attention as I usually do. And by the following Friday the S&P was down ~7% from November (seems like a quaint concern these days, though). If I was truly adhering to the system I would have reallocated my 401k out of traditional 'long' equity funds and gotten to safer ground with the S&P still around 1,478. Because I had seen this kind of show before and it wasn't pretty.
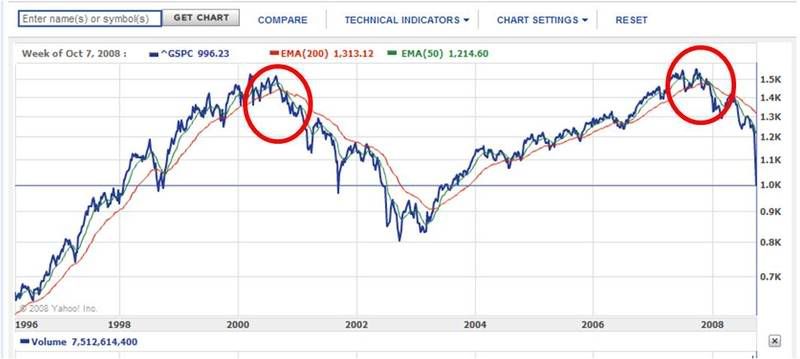
Image Source: Yahoo! Finance
S&P 500 breaks down in September 2000, beginning a downtrend that didn't turn until March 2003, after a drop of ~33%.
But I didn't. I waited a little bit, in case it was a false signal. I looked for it to get back up above its 50-day moving average as a sign. By late February that wasn't looking likely and I got out when the S&P was around 1,380. Took a little hit, but it could be absorbed. Comes with the territory, as they say.
That's the good news (for me, anyway). The problem is then that my 401K plan doesn't have any choices designed to really grow even during a bear market. We have a couple of short term income funds and a bunch of longer term funds that are great as long as the broader markets are great. In case you hadn't noticed, the broader markets haven't been great this year.
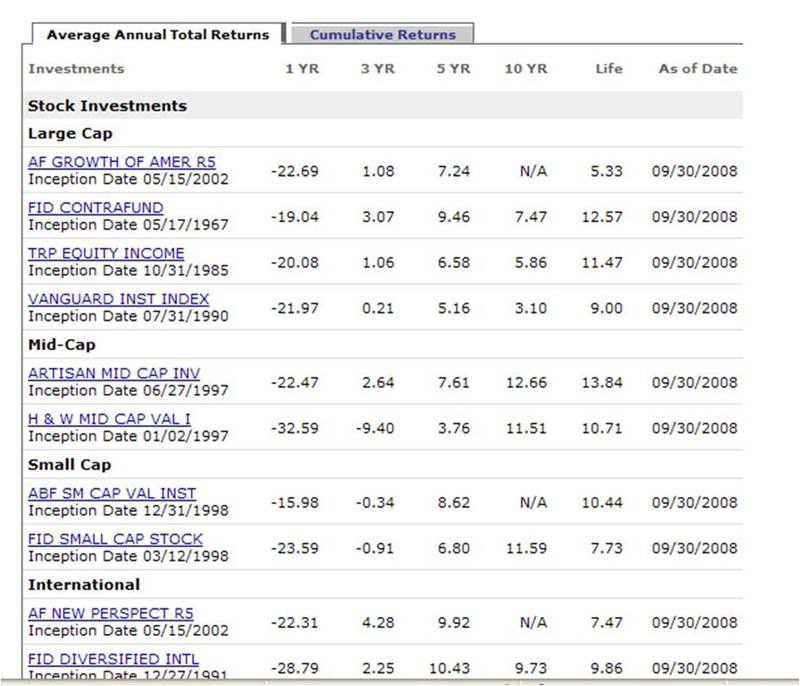
Most of my current 401k options have tanked along with the market
Here's how it looked yesterday when I pulled up the performance table. Not good times.
Publicis Groupe 401K choices
Publicis Groupe 401K choices
And you can see in this series of charts comparing the individual funds to the S&P 500 year-to-date that they all have been taking the same ugly ride down.
Note: charts were grabbed last night, before things got even uglier today. Also, the S&P is the red line in each chart, the blue line is the specific fund being compared to the S&P.
T. Rowe Price Growth Stock (PRGFX) - year to date
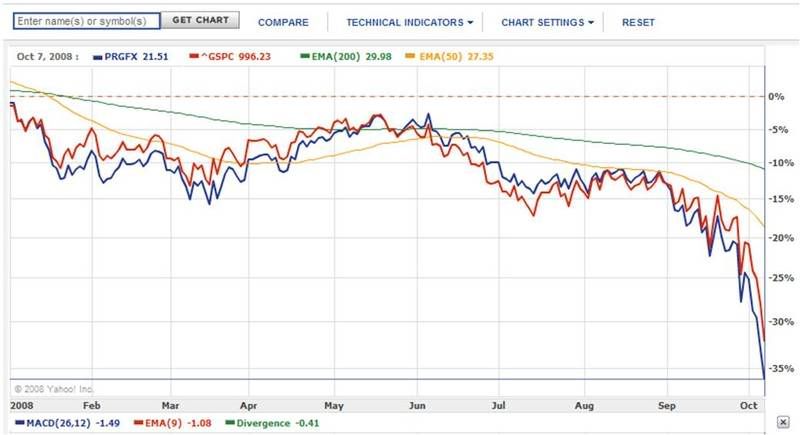
Image Source: Yahoo! Finance
Artisan Mid Cap Inv (ARTMX) - year to date
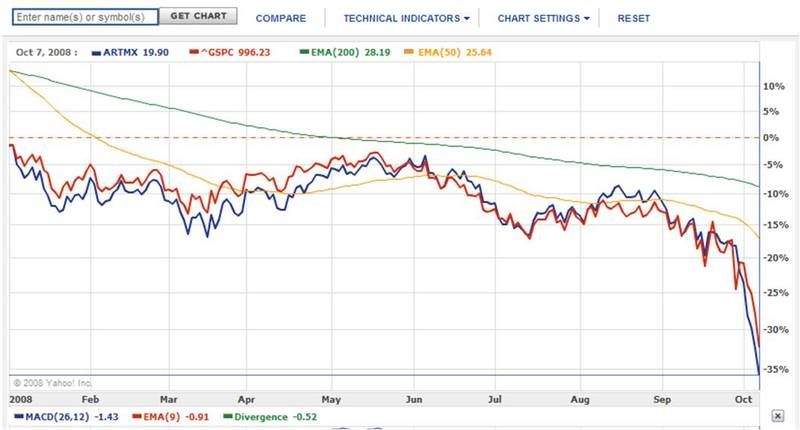
Image Source: Yahoo! Finance
American Beacon Small Cp Val Inst (AVFIX) - year to date
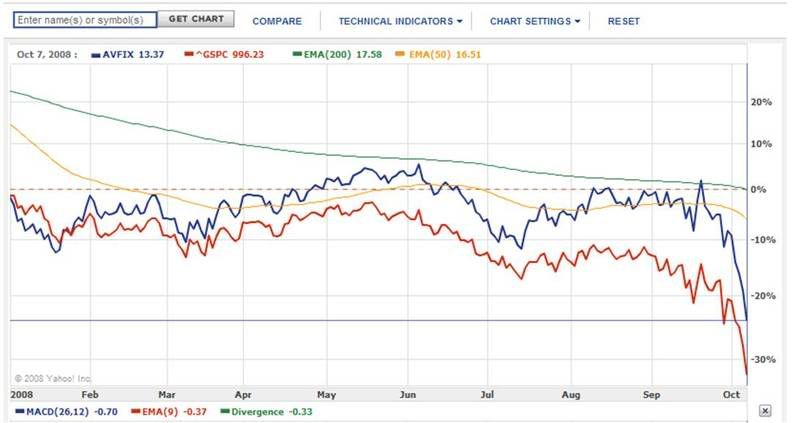
Image Source: Yahoo! Finance
Hotchkis and Wiley Mid-Cap Value I (HWMIX)
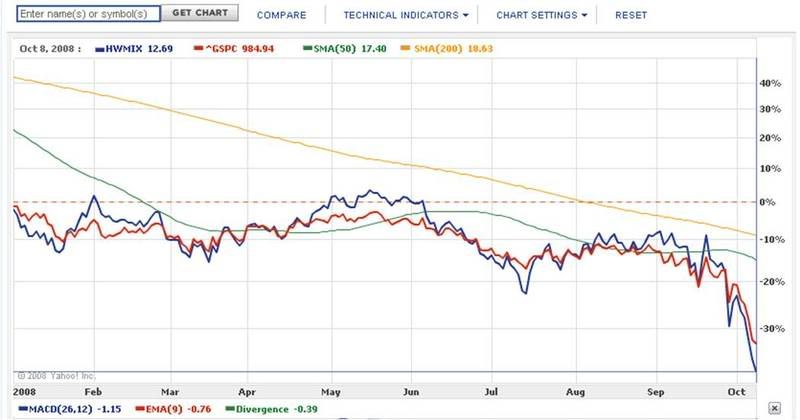
Image Source: Yahoo! Finance
Fidelity Freedom 2025 (FFTWX) - year to date
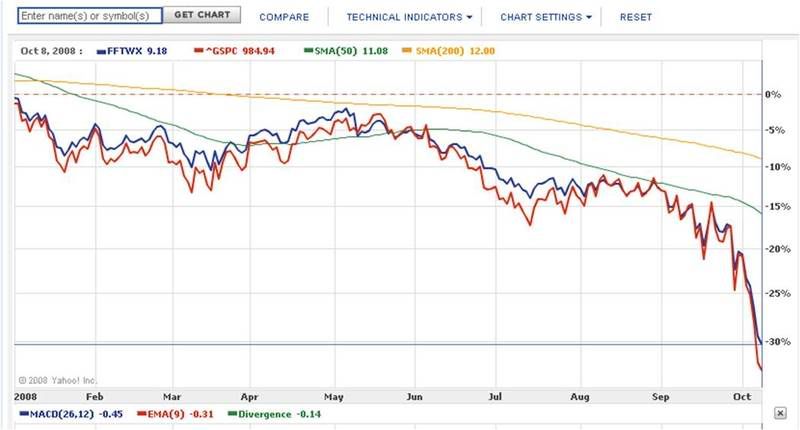
Image Source: Yahoo! Finance
Fidelity Freedom 2040 (FFFFX) - year to date
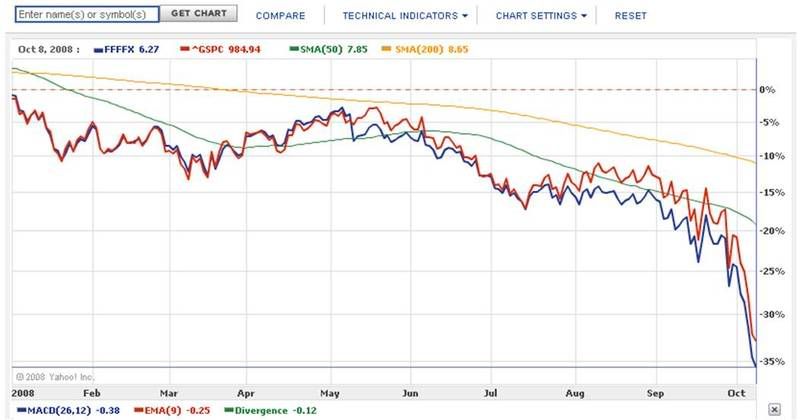
Image Source: Yahoo! Finance
Fidelity Freedom 2010 (FFFCX) - year to date
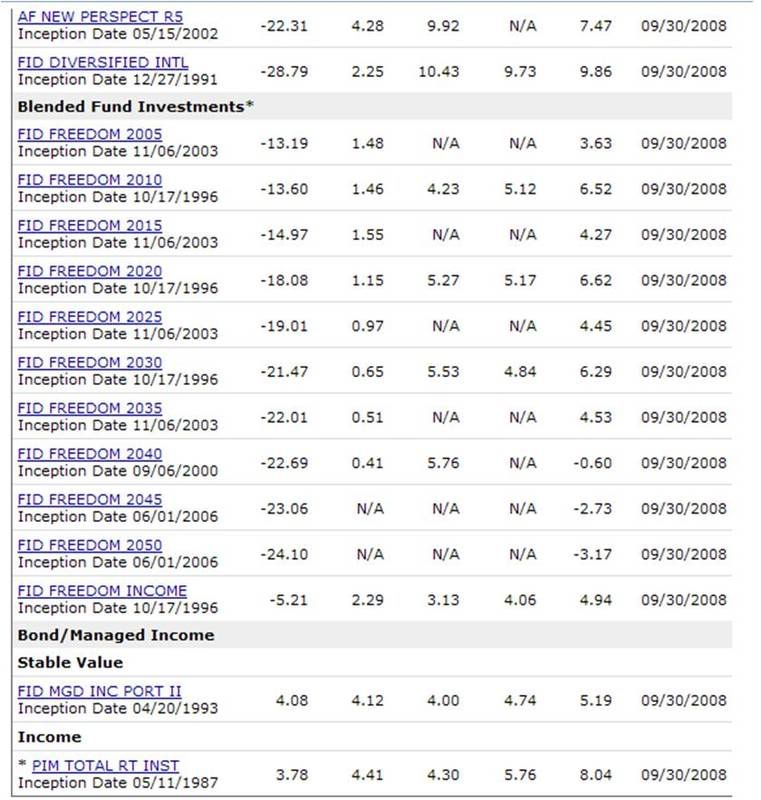
This is one of my favorites. Designed for those getting ready to retire in 2010. Should be getting into pretty 'safe' territory here. Down 25% year to date. Good grief.
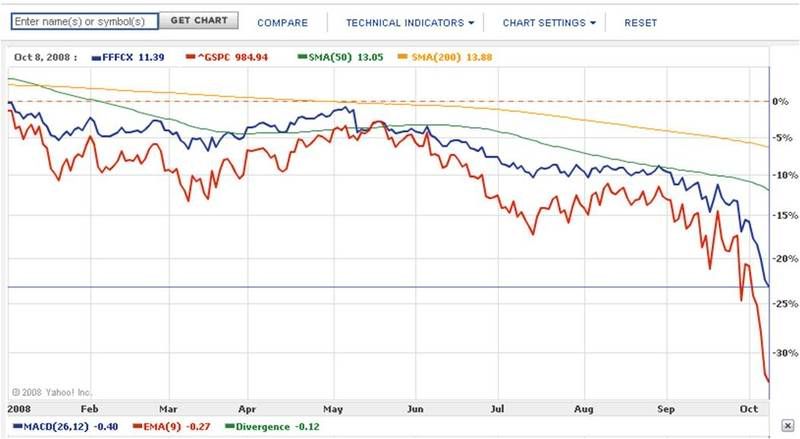
Image Source: Yahoo! Finance
Fidelity Contrafund (FCNTX) - year to date
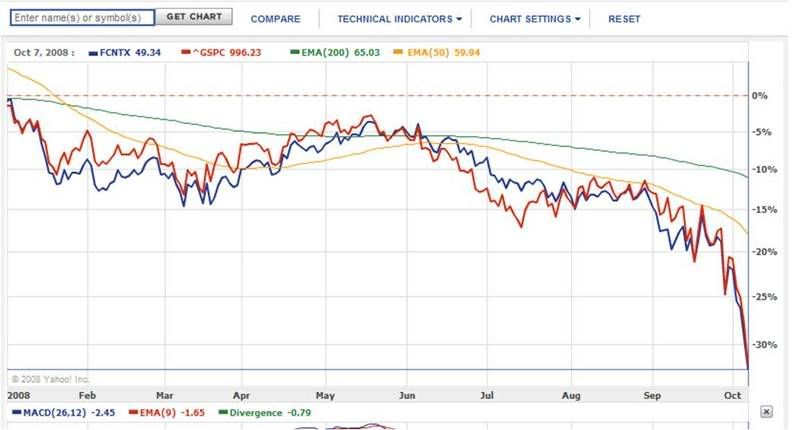
Image Source: Yahoo! Finance
One of two options I have in my 401K where I wouldn't have gotten crushed by this most recent downturn is PTTRX. Fortunately this is where I moved everything back in February. Those who advocate buy and hold, dollar cost averaging on the way down, smart and safe asset allocation and other similar nonsense would have howled at this move. But, Dick Fabian's red light / green light system tells me to move. I moved.
PIMCO Total Return Instl (PTTRX) - year to date
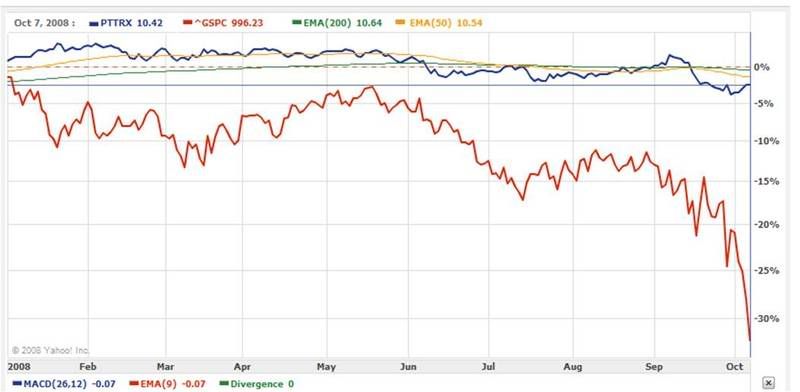
Image Source: Yahoo! Finance
The options I wish I had in my 401K
Earlier this year I asked someone in corporate HR about getting a bear market fund option in our 401k. I was told that kind of vehicle was speculative and irresponsible (I'm paraphrasing as I can't find the email to get the exact language). I was told, however, I could make a formal request in writing with some rationale. I might direct them to this post. What seems irresponsible to me is that some people are in a two-years-until-retirement fund and getting 25% of their @sses handed to them in 9+ months.
Wouldn't it have been nice if I could have allocated some share of my balance and ongoing contributions to one of these three?
Again, charts are as of last night, S&P is red, highlighted fund is blue
Prudent Bear (BEARX)- year to date up >20%
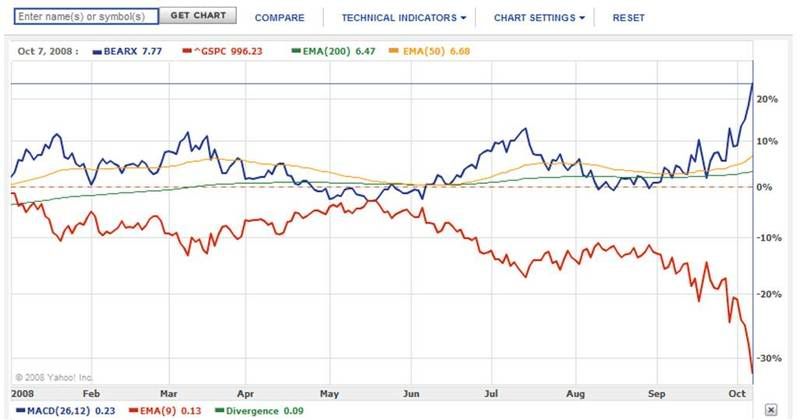
Image Source: Yahoo! Finance
Rydex Inverse S&P 500 Strategy Inv (RYURX)- year to date up >40%
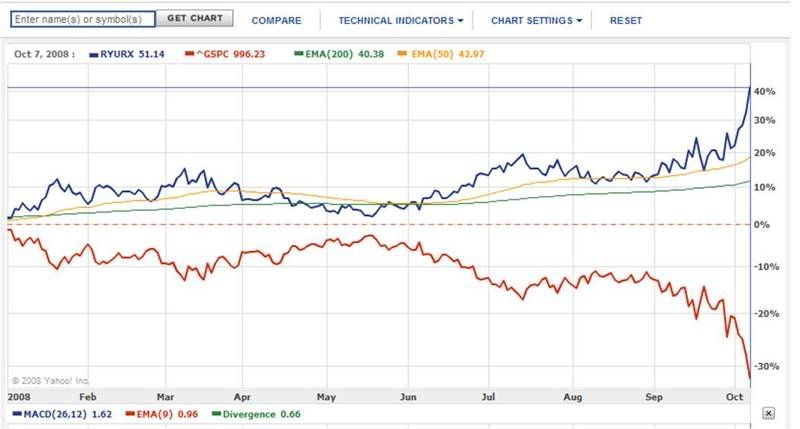
Image Source: Yahoo! Finance
Grizzly Short (GRZZX) - year to date up >60%
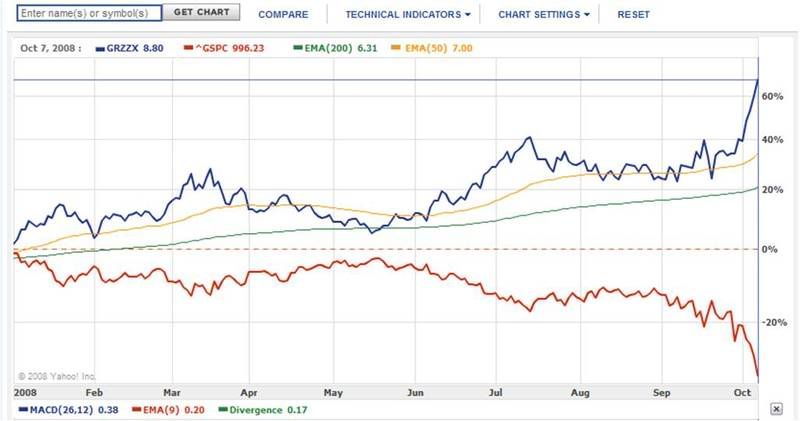
Image Source: Yahoo! Finance
It would have been more than 'nice'. It could have made an enormous difference in people's 401k balances 30 years from now. To illustrate exactly how much of a difference it could have made, I ran a few simple scenarios.
The bottom line break down
Assumptions:
- Initial 401K balance of $50,000 when S&P 500 triggers the bear market alarm as it did on 12/27/2007
- A total drop of 33.3% in the S&P before it triggers it's next bull market alarm (at yesterday's close of 984.84, the S&P was 33.3% below its 12/27/07 close of 1476.27
- After the 33.3% drop, no further contributions are made and all portfolios make 8% annual returns for 30 years
- Portfolio A does not get out at time of the bear market trigger and rides down with the S&P
End balance: $335,647
- Portfolio B gets out at the time of the bear market trigger and stays in cash on the sidelines
End balance: $503,133
- Portfolio C gets out at the time of the bear market trigger and reallocates to 50% cash, 50% a bear market fund designed to deliver returns inverse to the S&P
End balance: $586,876
- Portfolio D gets out at the time of the bear market trigger and reallocates 100% to a bear market fund designed to deliver returns inverse to the S&P
End balance: $670,619
- Portfolio E gets out at the time of the bear market trigger and reallocates 100% to a bear market fund designed to deliver returns that are twice the inverse of the S&P
End balance: $838,105
Now, depending upon the size of your initial stake at the trigger date, the absolute numbers will vary. But whether you have $5,000 and are just starting or $1,000,000 and are close to finishing, the percentages are the same.
* Take a 33% hit and it will take you ~6 years to get back to even at 8% per year.
* Get on the sideline and wait for the next up trend and you finish with 50% more money.
* Get out and reallocate into an aggressive bear market fund and you could have an extra $500,000 in 30-years. But, that might be speculative and irresponsible. Best to just put your lil' eggs in something nice, like FFFCX.
UPDATE 11/3/2009:
From WSJ.com:
Paragraphs below speak to the value of avoiding losses. Rest of the article ('Cruel Math of Big Losses') provides some conventional tips for those who might not be comfortable with technical trend analysis as an approach for sidestepping these big losses.
"If an investment declines 10%, it takes about an 11% gain to break even (assuming you don't pump in additional dollars). If the drop is 20%, you need a 25% gain to recover. A fall of one-third requires a rebound of 50%. And if your investment falls by half, "you need a double," or a 100% return, says Mr. Wiener, the New York-based editor of the Independent Adviser for Vanguard Investors. The recovery percentages grow exponentially because you have so few dollars working for you after a big loss.
Last year, the average diversified U.S.-stock fund was down 37.5%—requiring a 60% advance to break even—and plenty of funds were down 50% or more. Investors looking at this year's performance listings should know that some big gainers are volatile funds that were big losers last year; thus, investors' holdings may still be worth far less than they were in late 2007."
In 2000 & 2001 I saw my modest 401k cut by two thirds, as the NASDAQ went from 5,000 to 1,800. I thought I was doing everything right. I had been contributing with every paycheck. Had aggressive allocations since I was still a relative youngster. Thought everything was fine (there was still a touch of that go-go 90s vibe in the air, after all). But after I had settled into my new job and went through the process of setting up a new 401K and rolling over the old one into a Roth IRA, I had a WTF kind of moment. Two thirds - gone. That's nuts. I didn't know what to do, but I knew there had to be a better way.
I wish I could remember exactly how I found Dick Fabian's Mutual Fund Wealth Builder, because if anyone tipped me off I want to give them proper credit. But I may have just found it in Borders. And it changed my life. I know that might sound pretty weird and cultish, but it's true. His message isn't complicated. It gets pretty repetitive in places it definitely has stretches of high corniness. But the bottom line is he outlines a straightforward approach that is easy to follow and it can save your @ss in years like 2008.
The point is there are macro market trends that can give you a 'red light' or 'green light' kind of signal. Either get to safety and wait out the down draft, or get back on the elevator up.
I'm oversimplifying here, but if you see a couple of major, broad market indicators close below their 200-day moving average, that's a bad sign. On December 27, 2007, the S&P 500 dropped below its 200 day moving average.

Image Source: Yahoo! Finance
S&P 500 closes below its 200 day moving average on 12/27/07
That was a real crap time for it to break down because I personally wasn't paying as close attention as I usually do. And by the following Friday the S&P was down ~7% from November (seems like a quaint concern these days, though). If I was truly adhering to the system I would have reallocated my 401k out of traditional 'long' equity funds and gotten to safer ground with the S&P still around 1,478. Because I had seen this kind of show before and it wasn't pretty.

Image Source: Yahoo! Finance
S&P 500 breaks down in September 2000, beginning a downtrend that didn't turn until March 2003, after a drop of ~33%.
But I didn't. I waited a little bit, in case it was a false signal. I looked for it to get back up above its 50-day moving average as a sign. By late February that wasn't looking likely and I got out when the S&P was around 1,380. Took a little hit, but it could be absorbed. Comes with the territory, as they say.
That's the good news (for me, anyway). The problem is then that my 401K plan doesn't have any choices designed to really grow even during a bear market. We have a couple of short term income funds and a bunch of longer term funds that are great as long as the broader markets are great. In case you hadn't noticed, the broader markets haven't been great this year.
Most of my current 401k options have tanked along with the market
Here's how it looked yesterday when I pulled up the performance table. Not good times.

Publicis Groupe 401K choices

Publicis Groupe 401K choices
And you can see in this series of charts comparing the individual funds to the S&P 500 year-to-date that they all have been taking the same ugly ride down.
Note: charts were grabbed last night, before things got even uglier today. Also, the S&P is the red line in each chart, the blue line is the specific fund being compared to the S&P.
T. Rowe Price Growth Stock (PRGFX) - year to date

Image Source: Yahoo! Finance
Artisan Mid Cap Inv (ARTMX) - year to date

Image Source: Yahoo! Finance
American Beacon Small Cp Val Inst (AVFIX) - year to date

Image Source: Yahoo! Finance
Hotchkis and Wiley Mid-Cap Value I (HWMIX)

Image Source: Yahoo! Finance
Fidelity Freedom 2025 (FFTWX) - year to date

Image Source: Yahoo! Finance
Fidelity Freedom 2040 (FFFFX) - year to date

Image Source: Yahoo! Finance
Fidelity Freedom 2010 (FFFCX) - year to date
This is one of my favorites. Designed for those getting ready to retire in 2010. Should be getting into pretty 'safe' territory here. Down 25% year to date. Good grief.

Image Source: Yahoo! Finance
Fidelity Contrafund (FCNTX) - year to date

Image Source: Yahoo! Finance
One of two options I have in my 401K where I wouldn't have gotten crushed by this most recent downturn is PTTRX. Fortunately this is where I moved everything back in February. Those who advocate buy and hold, dollar cost averaging on the way down, smart and safe asset allocation and other similar nonsense would have howled at this move. But, Dick Fabian's red light / green light system tells me to move. I moved.
PIMCO Total Return Instl (PTTRX) - year to date

Image Source: Yahoo! Finance
The options I wish I had in my 401K
Earlier this year I asked someone in corporate HR about getting a bear market fund option in our 401k. I was told that kind of vehicle was speculative and irresponsible (I'm paraphrasing as I can't find the email to get the exact language). I was told, however, I could make a formal request in writing with some rationale. I might direct them to this post. What seems irresponsible to me is that some people are in a two-years-until-retirement fund and getting 25% of their @sses handed to them in 9+ months.
Wouldn't it have been nice if I could have allocated some share of my balance and ongoing contributions to one of these three?
Again, charts are as of last night, S&P is red, highlighted fund is blue
Prudent Bear (BEARX)- year to date up >20%

Image Source: Yahoo! Finance
Rydex Inverse S&P 500 Strategy Inv (RYURX)- year to date up >40%

Image Source: Yahoo! Finance
Grizzly Short (GRZZX) - year to date up >60%

Image Source: Yahoo! Finance
It would have been more than 'nice'. It could have made an enormous difference in people's 401k balances 30 years from now. To illustrate exactly how much of a difference it could have made, I ran a few simple scenarios.
The bottom line break down
Assumptions:
- Initial 401K balance of $50,000 when S&P 500 triggers the bear market alarm as it did on 12/27/2007
- A total drop of 33.3% in the S&P before it triggers it's next bull market alarm (at yesterday's close of 984.84, the S&P was 33.3% below its 12/27/07 close of 1476.27
- After the 33.3% drop, no further contributions are made and all portfolios make 8% annual returns for 30 years
- Portfolio A does not get out at time of the bear market trigger and rides down with the S&P
End balance: $335,647
- Portfolio B gets out at the time of the bear market trigger and stays in cash on the sidelines
End balance: $503,133
- Portfolio C gets out at the time of the bear market trigger and reallocates to 50% cash, 50% a bear market fund designed to deliver returns inverse to the S&P
End balance: $586,876
- Portfolio D gets out at the time of the bear market trigger and reallocates 100% to a bear market fund designed to deliver returns inverse to the S&P
End balance: $670,619
- Portfolio E gets out at the time of the bear market trigger and reallocates 100% to a bear market fund designed to deliver returns that are twice the inverse of the S&P
End balance: $838,105
Now, depending upon the size of your initial stake at the trigger date, the absolute numbers will vary. But whether you have $5,000 and are just starting or $1,000,000 and are close to finishing, the percentages are the same.
* Take a 33% hit and it will take you ~6 years to get back to even at 8% per year.
* Get on the sideline and wait for the next up trend and you finish with 50% more money.
* Get out and reallocate into an aggressive bear market fund and you could have an extra $500,000 in 30-years. But, that might be speculative and irresponsible. Best to just put your lil' eggs in something nice, like FFFCX.
UPDATE 11/3/2009:
From WSJ.com:
Paragraphs below speak to the value of avoiding losses. Rest of the article ('Cruel Math of Big Losses') provides some conventional tips for those who might not be comfortable with technical trend analysis as an approach for sidestepping these big losses.
"If an investment declines 10%, it takes about an 11% gain to break even (assuming you don't pump in additional dollars). If the drop is 20%, you need a 25% gain to recover. A fall of one-third requires a rebound of 50%. And if your investment falls by half, "you need a double," or a 100% return, says Mr. Wiener, the New York-based editor of the Independent Adviser for Vanguard Investors. The recovery percentages grow exponentially because you have so few dollars working for you after a big loss.
Last year, the average diversified U.S.-stock fund was down 37.5%—requiring a 60% advance to break even—and plenty of funds were down 50% or more. Investors looking at this year's performance listings should know that some big gainers are volatile funds that were big losers last year; thus, investors' holdings may still be worth far less than they were in late 2007."


Comments