Getting on the Sidelines & Hoping it's the Right Call
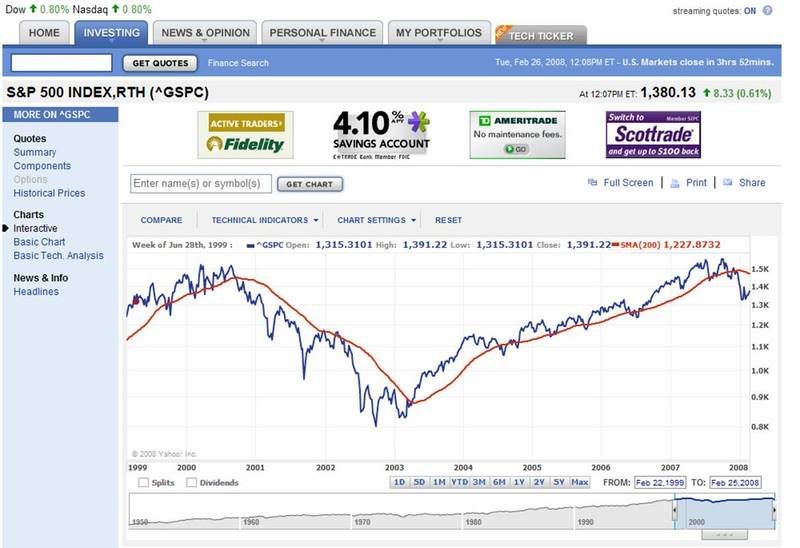
Note: Image is a chart of the S&P 500 from Feb 1999 - Feb 2008, drawn with the 200-day simple moving average (red line). Source: Yahoo! Finance
I was traveling and not paying as close attention to market indicators as I should have during the end of December / early January downturn, so I didn't get out as quickly as I would have liked. Now I'm hoping that by selling into this little rally I'm doing the right thing and getting onto the sidelines before we dip into an extended downturn. The current action looks eerily similar to the action of September 2000. If I'm going to stay true to the market signal approach I picked up from The Mutual Fund Wealth Builder: A Profit-Building Guide for the Savvy Mutual Fund Investor


Comments